
by Drs. Henry Quesada-Pineda and Brian Bond
Virginia Tech
Cutting energy costs remains a way that many wood products firms can trim operating expenses while continuing to develop new business prospects and serve existing customers. This article reviews the most commonly implemented energy recommendations for both the U.S. manufacturing sector and the wooden pallet sector. This comparison will then help in determining how lean principles can be implemented into your energy management practices and will provide a self-assessment to guide your energy audit process.
Although the majority of wood products manufacturing businesses continue to use multiple sources of energy such as wood waste, natural gas, coal, diesel, and waste oil; electricity represents the highest energy cost (62.5%). There are many resources available to the industry to assist in identifying energy saving opportunities. One of the most helpful energy saving resources is the database of energy recommendations created by the Industrial Assessment Centers at the Department of Energy (DOE), which are research centers tasked with spreading ideas relating to industrial energy conservation.
Top 10 Implemented Energy Recommendations
All of the recommendations and potential energy savings made by the Industrial Assessment Centers are recorded into a free-access database which contains more than 15,000 assessments and more than 116,000 energy recommendations, which are referenced by an Assessment Recommendation Code (ARC). The database can be accessed at this web link http://iac.rutgers.edu/database/ and it can also be downloaded in MS Excel format for further analysis.
Even though the energy assessment database includes a large variety of details about each energy assessment, the focus of this analysis is on three basic criteria: average savings per recommendation, average rate of implementation for each recommendation and the average payback period per recommendation. The average savings will be expressed based on the number of employees and the square footage, which is more useful for interested firms in quickly calculating potential energy savings based on their own size (employees and square footage). The implementation rates tell the times that a particular recommendation was implemented; and the average payback period is used as a measure of return of investment.
The top ten most implemented energy recommendations in the U.S. manufacturing sector are shown in Table 1. The practice or recommendation with the highest average savings per employee is “Analyze flue gas for proper air/fuel ratio” with $102.01/year savings. The highest average savings per ft2 is “Eliminate leaks in inert gas and compressed air lines/valves” with $5.05/year. In terms of payback the recommendation with the lowest average payback period is “Reduced the pressure of compressed air to the minimum required” with 0.29 years.
Table 1. Top Ten Most Implemented Energy Saving Recommendations in the U.S. Manufacturing Sector
|
ARC number |
Recommendation |
Average savings per employee ($/year) |
Average savings per ft2 ($/year) |
Implemented recommendations |
Average payback period (years) |
|
2.7142 |
Utilize higher efficiency lamps and/or ballasts |
$32.41 |
$0.05 |
5,862 |
1.89 |
|
2.4236 |
Eliminate leaks in inert gas and compressed air lines/ valves |
$39.99 |
$5.05 |
5,412 |
0.36 |
|
2.4133 |
Use most efficient type of electric motors |
$36.21 |
$0.06 |
3,103 |
2.84 |
|
2.4221 |
Install compressor air intakes in coolest locations |
$11.32 |
$0.02 |
2,198 |
0.79 |
|
2.4111 |
Utilize energy-efficient belts and other improved mechanisms |
$23.44 |
$0.03 |
2,094 |
0.65 |
|
2.4231 |
Reduce the pressure of compressed air to the minimum required |
$25.51 |
$0.03 |
1,707 |
0.29 |
|
2.7143 |
Use more efficient light source |
$35.94 |
$0.04 |
1,637 |
1.73 |
|
2.2511 |
Insulate bare equipment |
$99.30 |
$0.22 |
1,503 |
1.18 |
|
2.1233 |
Analyze flue gas for proper air/fuel ratio |
$102.01 |
$2.92 |
1,470 |
0.60 |
|
2.7135 |
Install occupancy sensors |
$18.88 |
$0.02 |
1,085 |
1.19 |
In the pallet and skid manufacturing sector, a total of 19 assessments have been conducted since 1985 with a total of 138 recommendations and an implementation rate of 45%. The average savings per implementation was estimated to be $60,4/employee $60 for each employee?} or $0.09/ft2 with an average payback period per implementation of 0.84 years. When comparing the recommendations to actual implanted practices, it was determined that pallet and skid manufacturers preferred to implement recommendations with the lowest payback period.
The most commonly implemented energy recommendation was ‘’Elimination of leaks in inert gas and compressed air lines/valves” (ARC 2.4236) with an average payback of 0.23 years and annual savings of $19.1 per employee or $0.025 ft2 respectively. The second most recommended opportunity was related to the installation of efficient lamps (ARC 2.7142) and the third most implemented recommendation was related to the use of more energy efficient motors (ARC 2.4133) and the installation of more energy efficient belts and mechanisms (ARC 2.4111). The practices implemented are mainly focused on improving energy consumption in machinery and building infrastructure rather than management practices such as lean thinking.
It is interesting to note that the top three implemented recommendations in the wooden pallet industry were the same as those for the entire U.S. manufacturing sector. In addition, when the top implemented recommendations for the primary and secondary wood industries were analyzed, results indicated that the same three recommendations (ARC 2.4236, 2.7142, and 2.4133) came as the most implemented ones. However; the savings (per employee and ft2) and the payback period averages are different between the wood products sector and the entire U.S. manufacturing sector.
Table 2. Main Statistics of Energy Saving Recommendations to the Pallet Industry
|
Implemented? |
Number of practices |
Average savings per employee ($/year) |
Average savings per square foot ($/year) |
Average payback (years) |
Average savings per practice ($/year) |
Average cost of implementation ($) |
|
Yes |
62 |
$60.40 |
$0.09 |
0.84 |
$3,848.18 |
$2,338.29 |
|
No |
68 |
$110.50 |
$0.15 |
1.44 |
$12,033.51 |
$24,081.63 |
|
Neither |
8 |
$24.87 |
$0.10 |
|
$6,191.75 |
$41,055.88 |
|
Total/Average |
138 |
$83.03 |
$0.12 |
1.15 |
$8,017.39 |
$15,296.90 |
Top Lean-based Energy Recommendations
Table 3. Lean Principles Implemented as Part of the Energy Assessments in Manufacturing Industries
Table 3 shows average savings, average implementation rates and average payback periods for lean principles that have been implemented by manufacturing firms in the United States as part of energy assessments. It can be seen from Table 3 that in 8 out of 10 cases, the payback period is less than one year.
Given that the savings per employee ranges from $60.24 to $ 1,118.29 and savings based on plant’s area go from $0.08/ft2 to $1.92/ft2, it is clear that recommendations based on lean principles can lead to greater savings and relative shorter payback times than actions listed in Table 1. The underlying strength of lean-based recommendations is that not only energy consumption is decreased but productivity is improved at the same time.
|
Lean principles |
ARC code |
Average savings per employee ($/year) |
Average savings per ft2 ($/year) |
Times recommended |
Implementation rate |
Average payback (years) |
|
Inventory reduction |
4.321 |
563.02 |
1.08 |
110 |
0.38 |
0.65 |
|
Total predictive maintenance plan |
4.611 |
243.14 |
0.33 |
424 |
0.53 |
0.45 |
|
Training on basic energy practices |
2.6218 and 2.6212 |
60.24 |
0.08 |
2171 |
0.59 |
0.32 |
|
Standard Operating procedures |
3.1191 |
349.36 |
0.43 |
433 |
0.38 |
1.1 |
|
Reduce scrap production |
3.1192 |
540.42 |
0.61 |
142 |
0.52 |
0.58 |
|
Kaizen teams |
4.711 |
278.37 |
0.42 |
78 |
0.42 |
0.64 |
|
Quick change procedures |
4.62 |
1018.41 |
1.20 |
168 |
0.51 |
0.6 |
|
Just-in-time implementation |
4.311 |
1118.29 |
1.92 |
33 |
0.55 |
0.64 |
|
Equipment layout |
4.513 and 4.514 |
345.86 |
0.65 |
344 |
0.40 |
0.69 |
|
Quality on the source |
4.425 |
442.40 |
0.38 |
50 |
0.38 |
0.54 |
|
5s |
4.424 |
298.51 |
0.30 |
130 |
0.32 |
1.24 |
Lean-based Energy Audit Tool
Given the significant relationship between lean principles and energy reduction recommendations, we have developed a lean-based energy audit tool to be used as a self-assessment for any manufacturing industry, including wooden pallet facilities. The following are the required steps to conduct this energy assessment.
Step 1. Understanding your energy consumption and charges: For any industry, it is critical to understand how energy is being used. A first task in this step is to study and understand your electric power bill. Try to arrange a meeting with your power company so they can explain how your company is being charged and in what ways your firm could make adjustments to save money. In many cases, small changes that require no or minimal capital investments such as different start up times or shutting down equipment in certain peak hours could have a large impact on your company finances. For example, in average quick starting procedures can save up to $1,2/ft2[HP2] and $1,108/employee per year in manufacturing firms.
One option to assess usage is to install an energy management system (EMS). An EMS provides energy consumption in real time, and it creates a database of your energy usage for later analysis. Alternatively, you could conduct an estimation of your electricity consumption based on the power ratings of the equipment used in your facility. Another option is to hire an energy consultant, who can visit your production facility and perform a more detailed electricity consumption analysis.
Step 2. Walk through the process. A process walk through audit captures what is really happening when people interact within and between the processes in your firm, eliminating the assumptions of what you think might be happening. For this particular case, the goal of a process walkthrough is to identify potential energy saving opportunities. Our research group at Virginia Tech has created an-easy-to-follow lean-based energy audit tool that will help your organization to identify potential energy saving opportunities through a process walk.
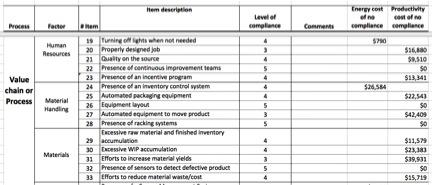
Figure 1 shows a partial view of the lean-based audit tool. The audit tool can be downloaded by visiting the web site www.woodinnovation.org. This tool is based on the most significant energy saving recommendations suggested by the DOE.
In order to use our lean-based audit tool, the user needs to provide the company SIC number, number of employees, and total firm area (ft2). The user will rate the status of 45 items using an ordinal scale (0: not apply, 1: very poor, 2: poor, 3: average, 4: good, and 5: excellent). The tool will automatically calculate if any of the items needs remedial or corrective action based on the scale shown in Figure 2. Information related to the cost of no compliance is also calculated for each item.
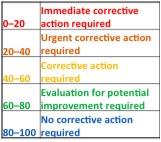
Figure 2. Scores and potential actions
The items in the checklist have been divided in the following factors: machines and equipment, man factor (human resources), material handling, materials, and management of the process. These items are not exclusively related to the lean principles, but they are also connected with more technical recommendations dealing with equipment and building infrastructure improvements.
Step 3. Incorporate electricity consumption into your value stream mapping: Lean thinking uses a technique called value stream mapping (VSM) to diagram the process as value chains. This mapping technique allows managers to easily separate value-added from non-valued activities (please visit the web page www.woodinnovation.org to learn how to develop a VSM). Once the VSM has been developed, the analysis on the VSM needs to focus on identifying potential opportunities for improvement. Critical to VSM is to add information related to each link of the value chain such as process times, availability, set up times, material yield and throughput. Given the increased cost of electricity it would be important to also add the electricity consumption for each process. Figure 3 shows an example where the user indicates that for every one thousand board feet (MBF) that is processed in this particular process, 220 KW are required.

Figure 3. Process information box in a VSM that includes electricity consumption.
To be able to add the electricity consumption to each process of the value chain, the managers need to directly measure or estimate the electricity consumption. In the first case, meters or direct readings can be obtained for each piece of equipment of the process in analysis. An alternative estimation can be conducted using an allocation technique where energy consumption can be allocated based on energy or production drivers such as production volume, number of machines, square footage or number of workers.
Step 4. Electricity consumption analysis. In this step, managers should analyze electricity consumption using a quantitative tool such as control charts. We recommend this statistical technique because it helps to keep the energy consumption variability under control and different control charts can be implemented for more than one process. Besides, control charts can help managers to identify potential problems and their root causes. A control chart that shows the expected consumption (average) and the upper and lower control limits is one of the many statistical control process tools that can help to identify potential problems and improvement opportunities.
Step 5. Kaizen events. A Kaizen event is a team session that focuses on improving a specific area or section of a process. Kaizen events can often improve process efficiencies from 20% to 100% in two to three sessions. These continuous improvement events are perhaps the most significant step in this methodology because it requires functional teams to analyze the current energy consumption status. The energy savings project leader should organize these events at least once every quarter. The Kaizen teams need to audit the process to verify if there has been progress and to identify potential new energy savings opportunities. As is the case in every continuous improvement project, sustaining and motivating personnel is always a difficult endeavor. The team leader should state clear goals and specific outputs for each meeting.

Figure 4. A Kaizen event in a flooring manufacturing facility.
Potential improvements should be ranked based on the various criteria such as payback period, implementation costs, savings, importance for customers or impact to the process. This prioritization will allow the manager to decide where to focus if remedial or corrective actions are required.
Significant Savings for Wooden Pallet Industries
When organizations conduct energy assessments, the main focus is typically on improving the energy efficiency of equipment and building infrastructure. However, there are also a significant number of management practices or lean principles that can be used to both increase productivity and decrease energy consumption. In this article, we have presented valuable information on the top recommendations (by savings and implementation rates) that manufacturing firms and the wooden pallet industries have been implementing. Further, the lean-based energy audit tool we have created could help wooden pallet companies easily identify where the energy saving opportunities are as well as estimate the savings, costs and payback period of potential recommendations